Last Update:
Finding memory leaks with Deleaker
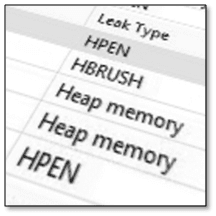
Table of Contents
Since the beginning of January I’ve had a chance to play with a nice tool called Deleaker. Its main role, as can be easily decoded, is to find leaks in your native applications. I often had problems creating and maintaining custom code that tracks leaks, so Deleaker seems to be a huge relief in those situations.
Let’s see how it works and how can it help with native app development.
Promotional note This review is sponsored. Still, the opinions expressed here are my own.
Intro
Basic product information:
Below there is a screenshot from the official site:

It’s quite simple: you have a list of resource allocations, with a source file, module, leak type, etc. Click on selected allocation and you will see its call stack. You can also double click on a call stack entry and go to a particular line of code that is responsible for the allocation.
How it works
Basically, Deleaker hooks into every possible resource allocation
function - like HeapAlloc, CreateFile, CreatePen, etc. and into
its counterparts like HeapFree, CloseHandle, DeleteObject, etc.
Every time your app performs an allocation the stack trace is being saved. While an application is running you can get a list of all allocations. When the app is closed Deleaker reports leaks that were not released to the system.
Simple example: when you write
int *tab = new int[10];
Deleaker will store information about this particular memory allocation.
When, at some point in the code, you use delete [] tab; then Deleaker
will record this as a proper memory deallocation - no leak will be
reported.
Let’s now test some code with Deleaker and then you will be able to see the tool in action.
Basic Test
I’ve opened solution github/fenbf/GLSamples from my previous OpenGL sample. Then, I enabled Deleaker and simply ran it in Debug Mode.
While the app was running I hit “Take snapshot” (on the Deleaker toolbar) and I got the following list of allocations:

As we can see there is a whole range of small allocations (made by std and crt library) and two large allocations made explicitly by the app.
The first buffer (stored in std::unique_ptr) is used to hold original
positions for triangles.
The second buffer (allocated using new []) stores temporary data that
is computed every frame and then sent to GPU.
You can click on the particular allocation and see its stack trace.
Then, I closed the application using the “X” button. At the end another ‘snapshot’ is automatically saved that shows the leaks.

On the list showed above, there is one interesting allocation that was
not released. I simply forgot to use delete [] gVertexBufferData!! The
first buffer (for triangles) was properly deleted, because I used a
smart pointer there. But the second buffer needs to be deleted
explicitly.
After looking at this problem more closely I figured out that that the buffer is destroyed when I press ESC key (in Quit function), but not when I use “X” window button (the Quit function is not called in that case).
So I could fix that by adding:
glutSetOption(GLUT_ACTION_ON_WINDOW_CLOSE,
              GLUT_ACTION_GLUTMAINLOOP_RETURNS);
After that I need to ensure that my cleanup function will be called in any condition.
More Leak Types
Of course, memory allocations are not the main things that can leak. Deleaker can track various system handles as well. Here is a dump from a popular app found at codeproject:
Snapshot while the app is running:

Here we can see HPEN and HBRUSH objects that were used by the
application.
Deleaker looks for functions like CreatePen or CreateSolidBrush.
Summary
After using Deleaker, I think, I can highly recommend this tool. In a few seconds you can get detailed reports from any kind of your native apps. All you have to do is to analyse it and fix the issues.
It’s great to have a separate tool rather than custom code that may or may not work. Of course, It’s possible to write such solution on your own. Still, I haven’t seen many projects that do such tracking well. Additionally, if you change a project you have to spend additional time ‘copying’ (and adapting) that leak-test code from other projects.
Other good solutions like VLD are very
helpful (and free), but it can only track memory allocations.
Deleaker hooks into almost every possible resource allocation function
so it can track a lot more issues.
Pros:
- User Interface that is very easy to learn.
- Works as Visual Studio extension window and as a standalone app.
- Finds lots of leak types (not only new/delete…)
- Useful for legacy application, MFC, win32, etc…
- Ability to take snapshots and compare allocations
- Full or compressed stack view,
- Easy to move to a problematic line of code
- Fast response from the support!
Cons:
- Sometimes you need to filter out leaks that comes not directly from
your app: like CRT, std or even MFC.
- It would be nice to have a public list of leaks that were reported and looks strange. That way if you are not sure about your leak you would be able to see if that had been already reported.
Links
- Buy Deleaker - with 30 day money back guarantee
- Deleaker official tutorial
I've prepared a valuable bonus if you're interested in Modern C++!
Learn all major features of recent C++ Standards!
Check it out here: